Best For
Teams this article is built to help
Category: FBA & Data Collection
Evidence
What backs this guide
This entry reads as practice guidance rather than a source-cited research summary.
Materials
What you can leave with
- Condensed key takeaways
- Primary downloadable resource
- Interactive self-check quiz
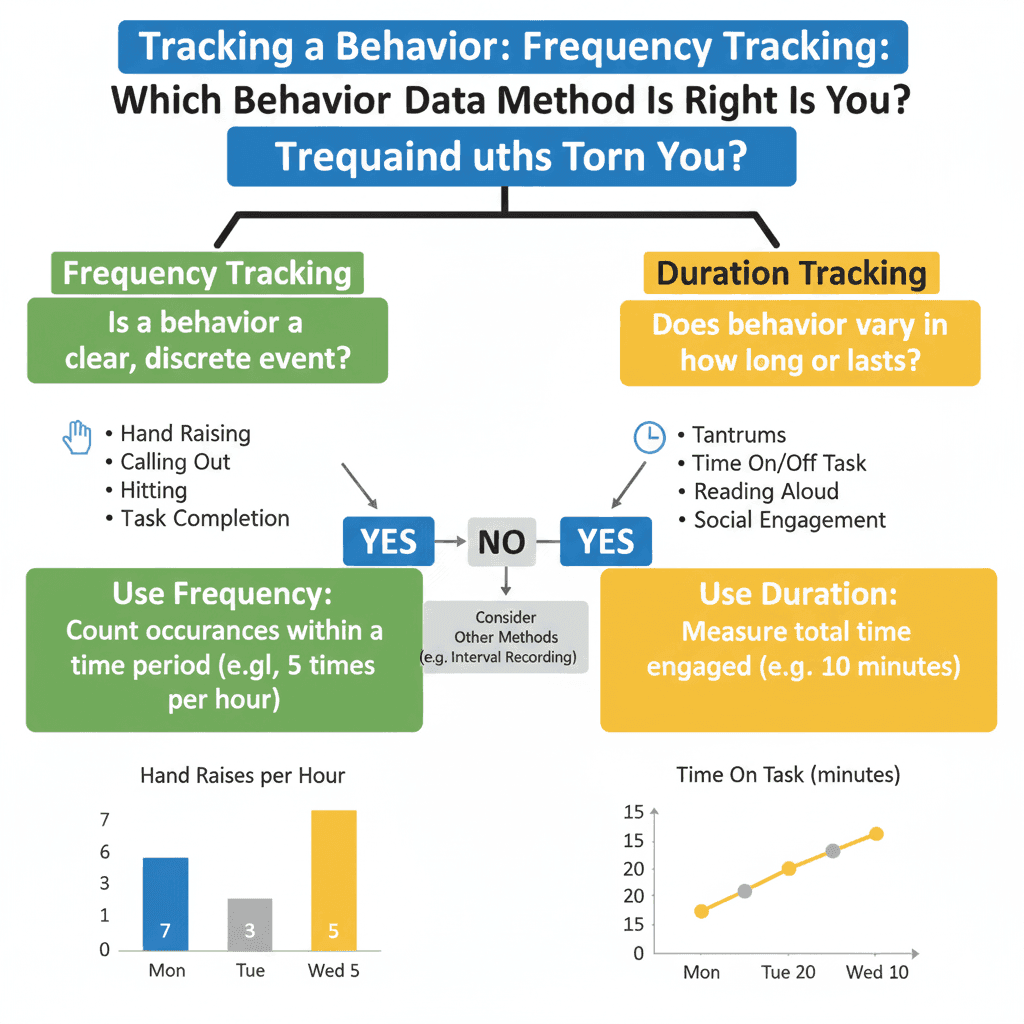
Frequency recording counts how many times a behavior happens; duration recording measures how long it lasts. Use duration when each occurrence has a clear start and end and its length matters (a 2-minute tantrum and a 30-minute tantrum are not the same event); use frequency when each occurrence is brief and roughly the same length. Interval recording is a third option for behaviors that are too frequent or too continuous to count or time one by one.
The Quick Answer: Frequency vs. Duration
Each data collection method captures a different dimension of behavior, so the choice changes what your data can tell you. Continuous methods such as frequency and duration record every occurrence, which means they can be reported in standard units like responses per minute or total minutes (Cooper et al., 2020). Interval methods sample the observation period instead, and they come with predictable measurement error (Gardenier et al., 2004).
| Method | Question it answers | Unit you report |
|---|---|---|
| Frequency (event recording) | How many times did it happen? | Count, or rate (count per minute or hour) |
| Duration | How long did it last? | Total or average time per episode |
| Latency | How long until it started after a cue? | Seconds or minutes from cue to response |
| Interval or time sampling | In how many sampled moments or intervals did it occur? | Percentage of intervals (an estimate) |
Key Insight
There is no best method, only the right method for the behavior you are tracking. A tantrum that happens twice but lasts 45 minutes each time tells a very different story than one that happens 20 times for 30 seconds each, and a frequency count alone would call the first one "less."
Frequency Recording: When Counting Works Best
Frequency recording (also called event recording) means tallying each occurrence of a behavior during an observation period. It answers: "How many times did this happen?"
Frequency recording fits behaviors that are:
- Discrete, with a clear start and end (hitting, calling out, hand raising)
- Brief, lasting seconds (throwing an object, spitting, a single vocalization)
- Similar in length from one occurrence to the next
- Low to moderate in number, so one observer can count them accurately
Convert Counts to Rate
Raw counts mislead when observation periods differ in length. Divide by time to get rate so days can be compared fairly. Cooper et al. (2020) describe rate as a basic, widely used measure of how often behavior occurs.
Rate = Count ÷ Time
Example: 15 call-outs in 50 minutes = 0.3 per minute, or 18 per hour
Hypothetical example: unequal observation periods
Imagine a student who calls out answers without raising a hand.
- Monday math (45 min): 12 call-outs = 0.27 per minute
- Tuesday math (45 min): 8 call-outs = 0.18 per minute
- Wednesday math (30 min, shortened by an assembly): 7 call-outs = 0.23 per minute
The raw counts (12, 8, 7) suggest steady improvement. The rates show a flatter pattern, because Wednesday was shorter.
When Frequency Is the Wrong Choice
- Variable length: a 2-minute episode and a 45-minute episode both count as "1."
- Very high frequency: when instances come faster than you can tally, counts become unreliable.
- No clear instances: humming, rocking, or staying engaged may not have a visible start and end.
A free frequency tracking template gives you a ready-made tally sheet.
Duration Recording: Measuring How Long
Duration recording measures how long a behavior lasts, from onset to offset. Because it depends on knowing exactly when the behavior starts and stops, your definition needs clear onset and offset criteria before you begin (LeBlanc et al., 2016).
Duration recording fits behaviors that:
- Vary in length: tantrums, work refusal, crying episodes
- Are continuous: on-task time, out-of-seat time, time engaged with a peer
- Matter because of time lost: a 30-minute episode costs more instruction than a 2-minute one
- May shorten before they become less frequent: duration can show progress that a count would miss
Two Ways to Report Duration
Total duration
The sum of all episodes in the observation period.
Example: out of seat for 23 minutes during a 60-minute class.
Average duration
Total duration divided by the number of episodes.
Example: 4 episodes totaling 23 minutes, averaging 5.75 minutes each.
Latency: A Related Time Measure
Latency recording measures the time between a cue (such as an instruction) and the start of the response. It is useful for task initiation. A student who begins after 5 seconds and one who begins after 90 seconds may both "comply," but they present very different support needs.
Hypothetical example: duration shows what frequency hides
Imagine a student who protests and cries when given non-preferred tasks.
| Day | Episodes | Total duration | Average |
|---|---|---|---|
| Monday | 3 | 28 min | 9.3 min |
| Tuesday | 4 | 18 min | 4.5 min |
| Wednesday | 3 | 12 min | 4.0 min |
The number of episodes barely changed (3, 4, 3), but average duration dropped from 9.3 to 4.0 minutes. A count alone would have shown no change. Three days is far too little to draw conclusions, but it shows why duration is worth collecting.
Use the duration tracking template to log start and stop times for each episode.
Interval Recording: Sampling Behavior
Interval recording divides the observation period into equal intervals and notes whether the behavior occurred in each one. It is practical when you cannot watch one student continuously, but it only estimates behavior, and the estimate is biased in a predictable direction (Cooper et al., 2020; Gardenier et al., 2004). Note that the result is a percentage of intervals, not a percentage of time.
Whole interval
Score "yes" only if the behavior lasts the entire interval. It tends to underestimate behavior, so it suits behaviors you want to increase, such as engagement.
Partial interval
Score "yes" if the behavior occurs at any point in the interval. It tends to overestimate behavior, so it suits behaviors you want to decrease, such as disruption.
Momentary time sampling
Score "yes" only if the behavior is happening at the exact moment each interval ends. It is the least demanding method and is useful for scanning several students, but it can miss brief, infrequent behavior.
Choosing an interval length
Shorter intervals give a closer estimate but demand more of the observer. Longer intervals are easier to manage but coarser. Match the interval to how quickly the behavior happens and how much attention you can realistically give. The interval recording template has a layout you can adjust.
How to Choose: Three Questions
1. Does the behavior have a clear beginning and end?
No: use interval recording or momentary time sampling. Yes: go to question 2.
2. Does each occurrence last about the same amount of time?
Yes: use frequency recording (hitting, call-outs, hand raising). No: go to question 3.
3. Is length of time the main concern?
Yes: use duration recording (tantrums, work refusal, crying). No, both matter: record frequency and duration together.
Quick Reference
| Method | Best for | Avoid when | Examples |
|---|---|---|---|
| Frequency | Brief, countable behaviors | Length varies widely, or counts are too fast to tally | Hitting, call-outs, hand raising |
| Duration | Time-based concerns, variable length | Brief, uniform behaviors | Tantrums, work refusal, crying |
| Whole interval | Behaviors to increase | Behaviors to decrease | On-task, engagement |
| Partial interval | Behaviors to decrease | Behaviors to increase | Disruption, stereotypy |
| Momentary time sampling | Several students at once, frequent behavior | Brief, infrequent behavior | Group engagement scans |
One Student, Three Methods
This is a composite, hypothetical example of how the same behavior looks through different measures. Imagine a student who frequently disrupts math class, observed for 45 minutes on three different days.
Day 1: frequency
8 verbal outbursts in 45 minutes, or 0.18 per minute. About one outburst every 5.6 minutes.
Day 2: duration
6 outbursts totaling 18 minutes, averaging 3 minutes each. About 40% of the period.
Day 3: partial interval (2-minute intervals)
Disruption in 15 of 22 intervals (68%). Disruption touched most segments of the class.
Each number describes a different dimension, and the days are not the same, so they should not be averaged together. Collected on the same days, they would show that the disruptions are frequent and also long enough to take a large share of instruction.
When to Combine Methods
Many behaviors have more than one important dimension. Pairing two measures can keep you from missing progress.
Frequency + duration
Use for: tantrums, crying, work refusal, leaving the area.
Episodes may get shorter before they get less frequent, so one measure alone can hide improvement.
Frequency + latency
Use for: following directions, starting tasks.
Complying after 90 seconds is not the same as complying after 5.
Start simple, then add
Begin with the one method that best matches the behavior. After a few days of baseline, ask whether a second dimension would change a decision. Collect only what you will use, and check that two observers can score the behavior the same way before you rely on the data. For more on common pitfalls, see 7 Behavior Tracking Mistakes That Undermine IEP Meetings, and for context on what happens before and after a behavior, see ABC Data Collection: Why Context Matters More Than Frequency.
Teachers and paraprofessionals can find more role-specific guidance on the Classroom Pulse page for teachers, and the data collection guide walks through the full process.
Frequently Asked Questions
How does frequency recording differ from duration recording?
Frequency recording counts how many times a behavior occurs. Duration recording measures how long each occurrence lasts, from start to finish. Frequency tells you how often; duration tells you how much time. A behavior can happen rarely but last a long time, or happen constantly in brief bursts, and the two methods will tell those stories differently.
True or false: duration recording measures the length of time a behavior occurs, and frequency recording measures the number of times a behavior occurs?
True. Duration recording is used to measure how long a behavior lasts, and frequency recording measures how many times it happens. If a quiz gives you this statement, it is accurate as written.
Which of the following are two ways to collect data on a behavior?
Frequency (event) recording and duration recording are the two most common ways to collect direct data on a behavior. Other direct options include latency recording, interval recording, momentary time sampling, and ABC (antecedent, behavior, consequence) recording. Frequency, duration, and latency are continuous methods that capture every occurrence; interval recording and time sampling are sampling methods that estimate it (Cooper et al., 2020). If a question lists several choices, choose the ones that name a measurement method rather than an assessment or a graph.
Ideally, how often should you summarize behavior acquisition data?
There is no single required interval, but the guidance in applied behavior analysis is to measure directly and review the data often, so decisions rest on current information rather than on a quarterly report (Cooper et al., 2020). In practice that usually means summarizing and graphing after each session or each day, with a team review at least weekly. Formal progress reports follow the schedule written in the student's IEP (34 C.F.R. § 300.320(a)(3)). If you are answering a course or exam question, use the answer your course materials give, since they may set a specific interval.
Put It Into Practice
Pick one behavior, write a definition two adults could score the same way, and match the method to the behavior using the three questions above. Then use a ready-made form so the tally or timing is quick and consistent.
Open the frequency tracking templateReferences
- Cooper, J. O., Heron, T. E., & Heward, W. L. (2020). Applied behavior analysis (3rd ed.). Pearson.
- Gardenier, N. C., MacDonald, R., & Green, G. (2004). Comparison of direct observational methods for measuring stereotypic behavior in children with autism spectrum disorders. Research in Developmental Disabilities, 25(2), 99-118. https://doi.org/10.1016/j.ridd.2003.05.004
- LeBlanc, L. A., Raetz, P. B., Sellers, T. P., & Carr, J. E. (2016). A proposed model for selecting measurement procedures for the assessment and treatment of problem behavior. Behavior Analysis in Practice, 9(1), 77-83. https://doi.org/10.1007/s40617-015-0063-2
- Individuals with Disabilities Education Act regulations, 34 C.F.R. § 300.320 (definition of individualized education program). https://www.ecfr.gov/current/title-34/subtitle-B/chapter-III/part-300/subpart-D/section-300.320
Put This Into Practice
Turn the article into action with ready-to-use materials. Downloads stay open; emailed resources and quiz results are opt-in.
Key Takeaways
- Frequency recording counts how many times a behavior occurs; duration recording measures how long it lasts.
- Use duration when each occurrence has a clear start and end and its length matters; use frequency for brief, similar-length behaviors.
- Convert counts to rate (count divided by time) when observation periods differ in length.
- Interval recording estimates behavior as a percentage of intervals; partial interval tends to overestimate and whole interval to underestimate.
- Pairing frequency with duration can show progress that either measure alone would miss.
Data Method Selection Guide
A decision matrix and quick-reference guide to help you choose the right data collection method for any behavior, with examples and conversion formulas.
Optional email delivery is only for sending this resource and educator updates if you choose them.
Which Data Method Should You Use?
Answer questions about a specific behavior and get a personalized recommendation for the best data collection method.
Tags:
For classroom teams
Match the Method to the Behavior
Use a ready-made form to tally occurrences or time each episode, then graph the results on one page.
Open the Frequency Tracking TemplateAbout the Author
Practical guides from the Classroom Pulse team for educators and behavior support teams who collect and use behavior data. Classroom Pulse was founded by Bobby Hillman, M.Ed., LBA, BCBA.
About Classroom PulseRelated Articles
Do Two Observers Agree? Running an IOA Check on School Behavior Data
Before mid-year decisions, check that a second observer would record the same thing. How to calculate each IOA method, what benchmark to borrow, and what to do when agreement is low.
Writing IEP Progress Reports for Behavior Goals: What the Data Should Say
A six-part narrative for IEP progress reports on behavior goals: baseline, current level, trend, measurement, whether progress is sufficient, and what changes next, with examples.
Before the FBA Referral: A Four-Week Data Packet Classroom Teams Can Build
What a classroom team can gather in about four weeks so an FBA referral starts from evidence: a definition, baseline, ABC entries, a time-of-day grid, and what was tried.